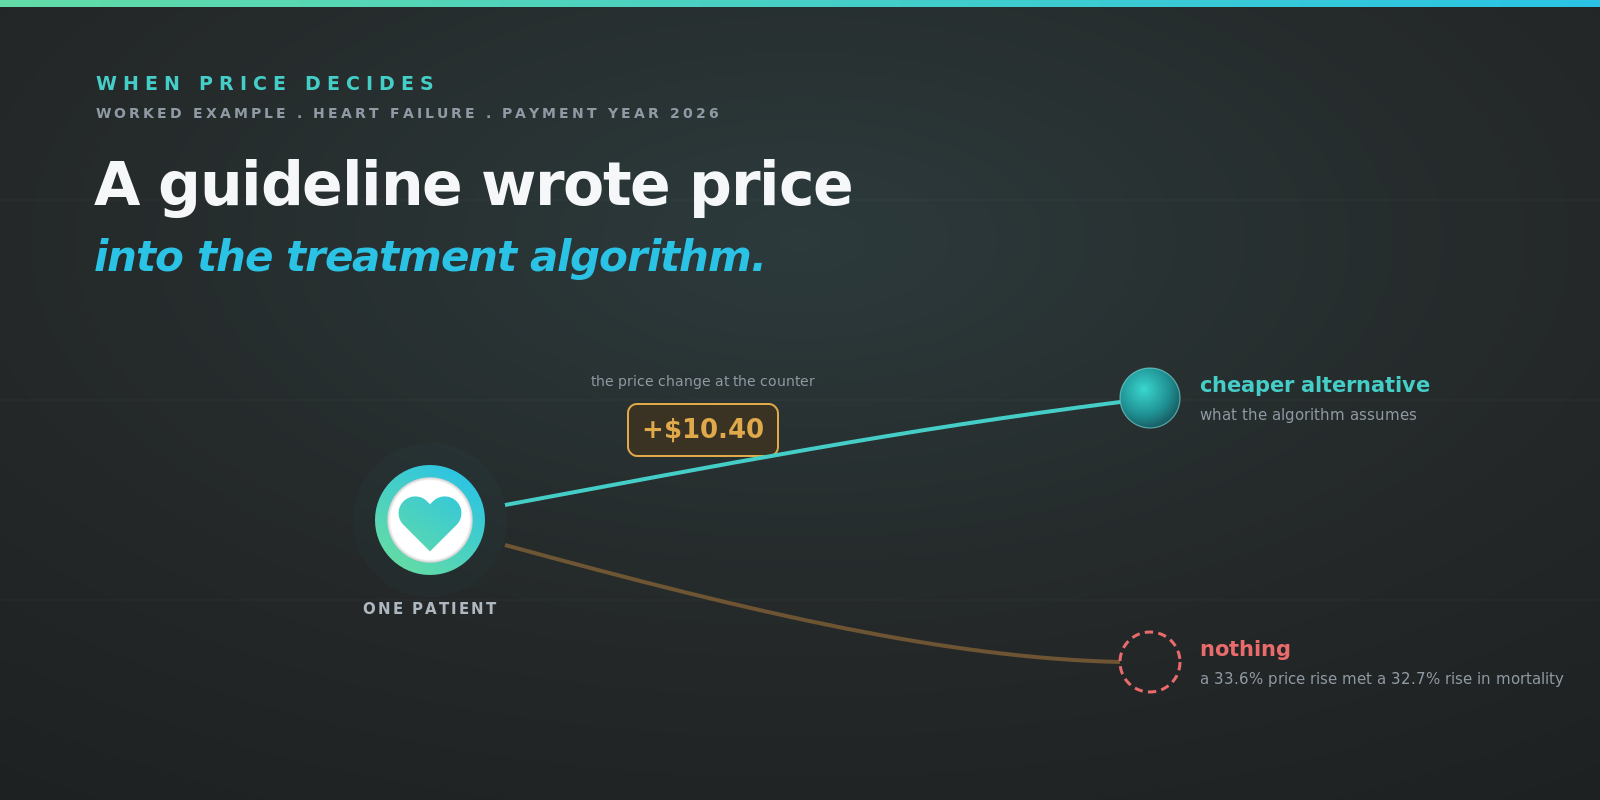
The 2026 ACC consensus pathway for preserved ejection fraction names finerenone the preferred agent, then offers spironolactone where cost is prohibitive. Affordability now sits in the treatment algorithm beside contraindication. The evidence on what patients actually do when price decides is worse than the substitution the pathway assumes.
Key Takeaways
- A major cardiology pathway now lists cost as a branch criterion in a treatment algorithm, twice, alongside intolerance and contraindication.
- The pathway assumes a rational substitution. Medicare Part D evidence shows patients facing higher prices do something else, which is to stop filling altogether.
- A 33.6 percent increase in out-of-pocket price produced a 22.6 percent drop in drug consumption and a 32.7 percent increase in monthly mortality.
- The cutbacks were concentrated in the highest-risk patients, who reduced statins and antihypertensives more than lower-risk patients did.
- Prior authorization is the other lever. It delayed SGLT2 inhibitor fills by a factor of 6.75 and made patients 2.23 times more likely never to fill at all.
- In that study Medicare was the least prior-authorized payer, which means the Medicare version of this problem runs through price rather than through paperwork.
The sentence worth noticing
Most of the 2026 ACC expert consensus decision pathway on heart failure with preserved ejection fraction reads as clinical documents read. One passage does not.
Having reviewed FINEARTS-HF and the mineralocorticoid receptor antagonist evidence, the writing committee concludes that finerenone should be considered the agent of choice in this population. The next sentence reads that "if cost or tolerance are prohibitive, spironolactone is a reasonable alternative." The treatment algorithm carries the same branch as an asterisked footnote, noting that a nonsteroidal agent offers the strongest evidence of benefit while a steroidal one is reasonable where cost is prohibitive.
It happens twice. On renin-angiotensin therapy, the pathway states that angiotensin receptor blockers "should be considered when angiotensin receptor-neprilysin inhibitors are contraindicated or unaffordable."
| Preferred agent | Alternative | Stated reason to switch |
|---|---|---|
| Finerenone, nonsteroidal MRA | Spironolactone, steroidal MRA | "if cost or tolerance are prohibitive" |
| Angiotensin receptor-neprilysin inhibitor | Angiotensin receptor blocker | "contraindicated or unaffordable" |
Exhibit 1. Source. Kittleson et al., Management of Heart Failure With Preserved Ejection Fraction, 2026 ACC Expert Consensus Decision Pathway, Journal of the American College of Cardiology, including the footnote to the treatment algorithm in Figure 6.
This is not a criticism of the committee. A pathway that ignored cost would be less useful to the clinicians reading it, and the authors are describing the world their readers practice in. The document is evidence about that world rather than a failure of it.
What follows from the observation is the interesting part. Affordability now sits in a clinical algorithm at the same level as a contraindication, which means the entity setting the price is making a therapeutic decision. An earlier piece in this research argued that benefit design suppresses a heart failure regimen that pays the plan back, using this exact substitution as the example. The pathway has now formalized it.
What patients actually do when price decides
The algorithm assumes a substitution. The patient who cannot afford finerenone receives spironolactone, which is clinically reasonable and considerably cheaper. Nobody goes untreated.
The Medicare evidence does not support that assumption. Chandra, Flack and Obermeyer used a discontinuity in the design of the Part D benefit to isolate the effect of out-of-pocket price on drug consumption and on survival. The results are among the most uncomfortable in health economics.
Exhibit 2. Source. Chandra A, Flack E, Obermeyer Z, The Health Costs of Cost-Sharing, National Bureau of Economic Research Working Paper 28439, February 2021. Figures as reported in the abstract.
Two details matter more than the headline.
The first is that patients did not cut low-value care. The authors report no indication that the reductions affected only low-value drugs, and find the opposite pattern. Those at the highest risk of heart attack and stroke, meaning the people for whom statins and antihypertensives carry the largest survival benefit, cut back on those drugs more than lower-risk patients did. The same pattern held across other drug and disease pairs and across socioeconomic circumstance.
The second is the mechanism. Faced with a complex choice about which of several medicines to keep, patients responded in what the authors call simple, perverse ways. Price increases caused 18 percent more patients to fill nothing at all, regardless of how many drugs they had been taking or how sick they were. The behavior at the counter is not triage between agents. It is withdrawal from the category.
That is the finding that undermines the branch point. A pathway offering a cheaper alternative presumes the patient arrives at the pharmacy, learns the price, and selects down. What the Part D data show is a meaningful share arriving, learning the price, and leaving with nothing. The authors' own conclusion is the one to carry forward. Cost-sharing schemes should be evaluated on their overall impact on welfare, which can be very different from the price elasticity of demand. A plan measuring only the elasticity sees a benefit design working as intended.
The other lever, and who it lands on
Price is one instrument. Prior authorization is the other, and it has now been measured directly on the two heart failure drug classes this series keeps returning to.
Mukhopadhyay and colleagues linked electronic health record orders to pharmacy fills across 2,183 patients in a large academic system between April 2021 and April 2023. Linking orders to fills matters, because it makes visible the prescriptions that were written and never filled, which claims data cannot see.
| Outcome | Effect of prior authorization |
|---|---|
| Time to first fill, ARNI | 3.03 times longer (95% CI 2.16 to 4.25) |
| Time to first fill, SGLT2 inhibitor | 6.75 times longer (95% CI 4.44 to 10.3) |
| Never filling the prescription, SGLT2 inhibitor | 2.23 times more likely (95% CI 1.37 to 3.65) |
| Prescriptions facing a requirement | 12.2 percent of ARNI, 14.3 percent of SGLT2 inhibitor |
Exhibit 3. Source. Mukhopadhyay A, Adhikari S, Li X, et al., Prior Authorization Requirements and Prescription Fill Patterns Among Patients With Heart Failure, JACC Advances, 2026, volume 5, article 102583, a retrospective cohort at a single academic health system using inverse probability weighting.
The requirement fell unevenly. Patients facing prior authorization were more likely to identify as non-Hispanic Black or Hispanic, and more likely to live in lower socioeconomic status neighborhoods. The authors note that over 80 percent of eligible patients are never prescribed these medications in the first place, and that among those who are, only 30 to 50 percent take them regularly. Prior authorization operates on the remainder.
One finding deserves care, because it runs against the assumption a Medicare Advantage reader would bring. Medicare was the least prior-authorized payer in this sample. Medicare accounted for 8.6 percent of the ARNI prior-authorization group against 64 percent of the group facing no requirement, and the authors observe that Medicare plans have previously been reported to carry fewer prior authorization requirements for this class.
Read that carefully rather than comfortably. It does not mean Medicare beneficiaries face fewer obstacles. It means the obstacle is a different one. Where commercial and Medicaid coverage restricts through paperwork, Medicare restricts through price, and the Part D evidence on price is a mortality finding rather than a delay finding.
Where the cost lands
Both levers sit on the pharmacy benefit. Both are set by the plan. Neither is measured against what happens next.
A companion piece in this series works out what happens next in payment terms. Medicare risk adjustment is built for reactive care across disjointed medical and pharmacy benefits, paying roughly 17 times more for a heart failure diagnosis on the medical model than on the drug model, while bid rules prevent a Part D filing from referencing the medical savings a drug program produces. The plan that sets the copay or the prior authorization captures the drug-side saving in a bid that cannot account for the hospitalization it causes.
Put the two literatures side by side and the sequence is complete. Benefit design raises the effective price of guideline therapy. Patients respond by abandoning the category rather than substituting within it, with the sickest abandoning most. The exacerbation arrives as an admission under Parts A and B, in a different filing, in a later year. The pharmacy ledger records a saving.
Erik's Hot Take
A clinical guideline listing unaffordability beside contraindication is a small editorial decision and a large piece of evidence. It says that price has become a therapeutic variable, and that the people writing treatment algorithms have stopped pretending otherwise.
The gray space is that the substitution the algorithm offers is more optimistic than the data supports. Writing down a cheaper alternative assumes the patient trades down. A 32.7 percent increase in mortality attached to a $10.40 price change says a meaningful share does not trade down at all.
The white space belongs to whoever measures the thing nobody measures. Plans track elasticity, fill rates and net drug cost, all of which look fine when a patient quietly stops filling. None of that captures abandonment, and none of it connects abandonment to the admission that follows. A benefit design evaluated on elasticity alone is being graded on the one number that cannot detect the harm.
The 2026 recalibration piece covers what happened to heart failure drug economics this year, and the upstream piece follows the problem to the point before diagnosis where neither risk model can see the patient at all.
Frequently asked questions
Does cost sharing affect whether patients take heart failure medications?
Yes, and the effect reaches mortality. Using a discontinuity in the Medicare Part D benefit, Chandra, Flack and Obermeyer found that a 33.6 percent increase in out-of-pocket price, about $10.40 per drug, produced a 22.6 percent drop in total drug consumption and a 32.7 percent increase in monthly mortality.
Do patients cut back on low-value drugs first?
No. The authors found no indication that reductions affected only low-value drugs, and found the reverse pattern. Patients at the highest risk of heart attack and stroke cut back on statins and antihypertensives more than lower-risk patients did, despite standing to benefit most from them.
What does prior authorization do to heart failure prescriptions?
In a cohort of 2,183 patients linking orders to fills, a prior authorization requirement made ARNI fills take 3.03 times longer, SGLT2 inhibitor fills 6.75 times longer, and made patients 2.23 times more likely never to fill an SGLT2 inhibitor prescription at all.
Do Medicare Advantage plans use prior authorization on heart failure drugs?
Less than commercial and Medicaid coverage does, at least for these classes. In the cohort above, Medicare accounted for 8.6 percent of the prior-authorization group for ARNI against 64 percent of the group facing no requirement. The Medicare constraint on these therapies operates primarily through cost sharing rather than through prior authorization.
Why would a clinical guideline mention cost at all?
Because the clinicians using it practice in a system where price determines what patients can obtain. The 2026 ACC pathway for preserved ejection fraction names finerenone the preferred mineralocorticoid receptor antagonist and offers spironolactone where cost is prohibitive, and offers angiotensin receptor blockers where neprilysin inhibitors are unaffordable.
What is a calibration moat?
A calibration moat exists wherever two payment models are fitted against disjoint cost pools for the same population. Each model predicts its own pool well. Neither can price a substitution between them, because the substitution does not appear in either dependent variable. Better data integration does not resolve it, because the constraint is the model specification.
Method and sources
The treatment algorithm language comes from Kittleson MM, Panjrath GS, Bates K, et al., Management of Heart Failure With Preserved Ejection Fraction, 2026 ACC Expert Consensus Decision Pathway, published in the Journal of the American College of Cardiology, including the footnote to the treatment algorithm figure. Quotations are verbatim.
Cost-sharing effects come from Chandra A, Flack E, Obermeyer Z, The Health Costs of Cost-Sharing, National Bureau of Economic Research Working Paper 28439, February 2021. Figures are as reported in the paper's abstract. The identification strategy exploits a discontinuity in the Medicare Part D benefit as it was structured at the time of study, which predates the Inflation Reduction Act redesign. The mechanism is not specific to any single benefit structure, and the magnitudes should be read against the benefit design in force during the study period rather than the current one.
Prior authorization effects come from Mukhopadhyay A, Adhikari S, Li X, et al., Prior Authorization Requirements and Prescription Fill Patterns Among Patients With Heart Failure, JACC Advances, 2026, volume 5, article 102583. This is a retrospective cohort at a single academic health system, analyzed with inverse probability weighting. The authors flag limited generalizability, the possibility of residual confounding by payer, and note that New York State Medicaid does not require prior authorization for these classes, which shapes the payer mix. The Medicare comparison reported here reflects the composition of this sample and should not be read as a national estimate of Medicare prior authorization rates.
This piece is analysis and commentary based on public sources and professional experience as of the date noted, and nothing in it constitutes legal, clinical, or financial advice. Descriptions of benefit design, formulary and utilization management practices are general characterizations of common industry structures and are not directed at any specific company or plan. Nothing here should be read as a recommendation for or against any therapy for any individual patient. Interpretive conclusions are the author's opinion, offered for analytical discussion. All views reflect independent professional judgment and do not represent the views or positions of any current or former employer or affiliated organization.