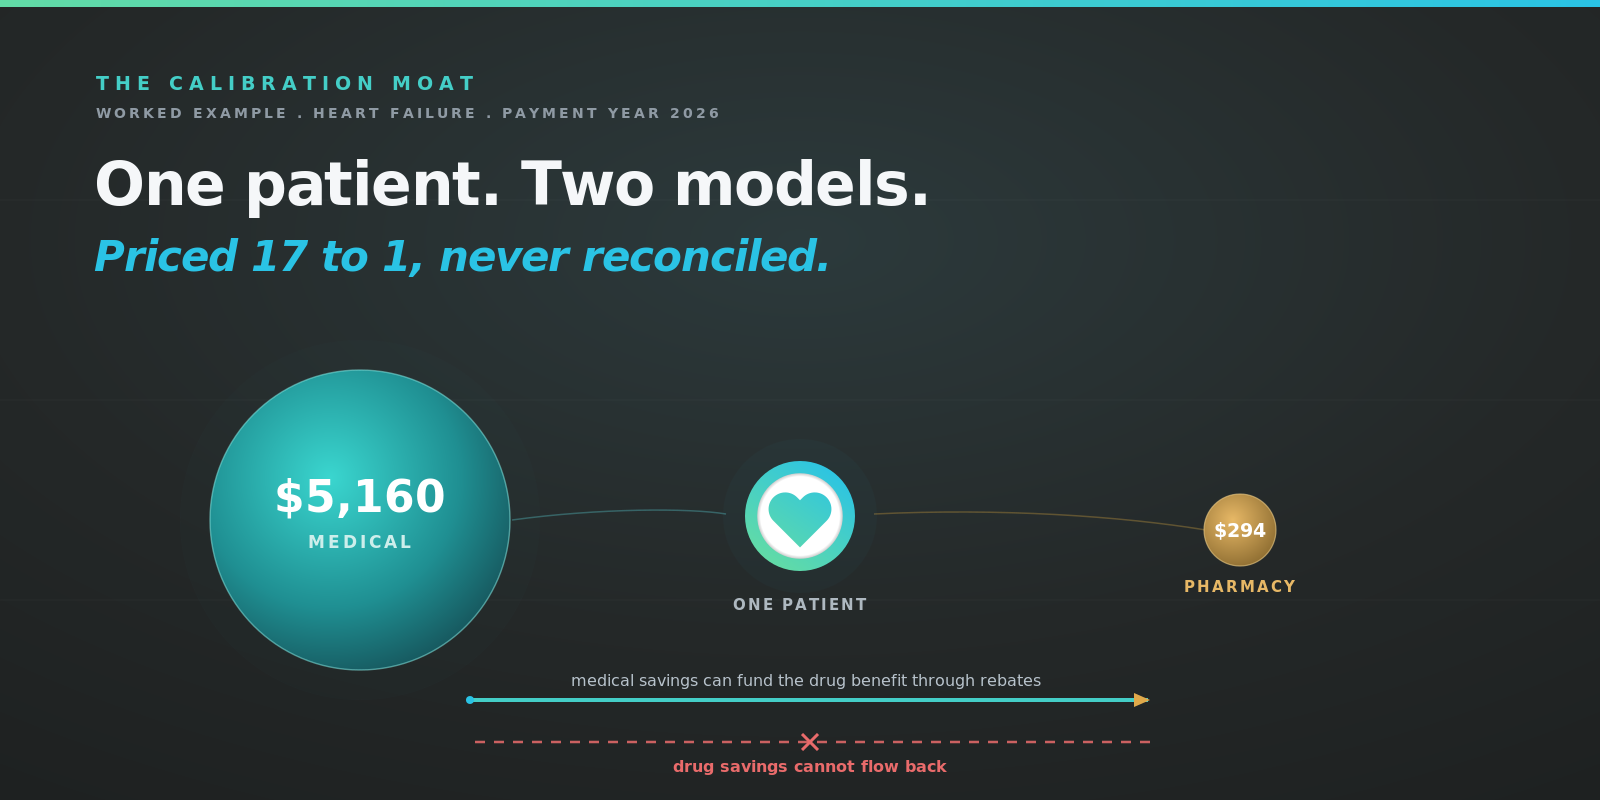
Medicare runs two risk adjustment models on the same patient, one for the medical benefit and one for the pharmacy benefit, and the rules keep them from ever meeting. The result pays for disease that has arrived and for deterioration once it does. Heart failure is where that shows most clearly, at roughly 17 to 1 between the two models for the same diagnosis.
Key Takeaways
- Medicare risk adjustment is built for reactive care. It pays on a coded diagnosis, pays more as the patient deteriorates, and pays nothing before the disease arrives.
- The medical benefit and the pharmacy benefit are scored separately and are forbidden from referencing each other in the filings that set payment.
- A heart failure diagnosis carries roughly $5,160 a year of medical-side revenue and $294 on the drug side. On the margin, against an already coded hypertensive member, the drug side pays about $194.
- The documentation standard that justifies the medical payment asks the plan to show it is treating the condition. In heart failure the treatment is drugs, which the plan buys on the other side of the divide.
- Both models draw diagnoses from the same encounter records. What separates them is the calibration, since each is fitted against an expenditure pool the other cannot observe.
- Part C risk scores are cut 5.90 percent each year for coding pattern differences. Part D receives no equivalent correction, and the asymmetry is statutory.
- The mechanism holding the divide in place is the bid. Medical savings can fund drug benefits through the Part C rebate channel, and no route runs the other way.
- The clinical definition treats heart failure as permanent. Both payment models require it re-documented every year, so the best-managed patients are the ones most likely to fall out of the risk score.
- Heart failure is the worked example, not the boundary. Chronic kidney disease shows the same asymmetry, at 0.815 on the medical side against 0.009 on the drug side.
- The general form of the problem is a calibration moat, which appears wherever two payment models are fitted against disjoint cost pools for the same population.
The short version
Medicare pays a health plan more to cover a patient with heart failure. To justify that payment, the plan has to show the condition is being monitored, evaluated, assessed and treated. Coders call this the MEAT standard, and it is what separates a diagnosis that counts from one that does not.
In heart failure, the treatment is medication. Four drug classes, taken together, are what the guidelines mean by treating the condition.
Those drugs are paid for out of a different budget, managed by a different team, under different rules, in a plan filing that is not allowed to mention the budget that earned the payment. The medical side is asked to demonstrate treatment. The pharmacy side buys it. Nobody adds the two together, because the rules do not permit anyone to.
A diagnosis by itself changes nothing for the patient. A diagnosis plus management may change a great deal. Medicare pays generously for the first and awkwardly for the second, and this piece works out how much the difference is worth.
Built for disease that has already arrived
Step back from heart failure for a moment, because the pattern is larger than one condition.
Medicare risk adjustment pays prospectively on a coded diagnosis. A code requires a disease, a disease requires a diagnosis, and a diagnosis requires the condition to have arrived. Everything upstream of that moment is invisible to the payment system, however well evidenced and however expensive it will become.
Once the disease has arrived, the model responds to worsening. In heart failure the only documented change in a patient's state that increases payment is deterioration toward end stage, where the coefficient moves from 0.360 to 2.505. Successful management produces no equivalent signal. A patient whose ejection fraction recovers is, to the payment system, either unchanged or absent.
Prevention sits on the wrong side of the divide as well. Where the intervention is pharmacologic, which upstream it almost always is, the spending lands on the pharmacy benefit while the avoided admission lands on the medical benefit. The two are scored by different models, filed in different bids, and prohibited from referencing each other.
Figure 1. A system built for reactive care. The only documented state change that increases payment is deterioration. Successful management produces no signal at all.
That is a system built for reactive care. The rest of this piece works out the arithmetic underneath it, using heart failure because the clinical evidence is settled and the offset is large and measured, though the structure is not specific to heart failure at all.
The silo, written down
An earlier piece in this research described the medication access paradox, and at its center sat the medical-pharmacy silo. A formulary decision lowers drug cost. The resulting exacerbation lands as a hospitalization in a different ledger. The two data sets are never connected, so the lesson is never learned.
That account treated the divide as an organizational failure, something a determined plan could engineer its way out of with better data. Medicare is the cleanest test of that idea, because it is the one place where the divide was specified, calibrated and published rather than left to emerge from internal politics.
Better data would not close it. Diagnoses already reach both models from the same encounter record. What separates them is arithmetic that neither model is permitted to perform.
The question the literature has not been asking
The current reference work is thorough and points somewhere else. Lowe and colleagues published a JACC state-of-the-art review in 2025 on high out-of-pocket costs for heart failure medications, and it is the best available map of the patient ledger. It covers formulary tiering, coverage phases, deductibles, manufacturer assistance, and the cost transparency tools that would let a clinician see a real price during a visit. Its findings are pointed. Across a 2023 all-plan analysis, sacubitril and valsartan and empagliflozin were universally covered and most often placed on tier 3, with median monthly cost sharing of $47 per drug. Willingness to take sacubitril and valsartan runs at 85 percent when the patient pays $10 a month, 62 percent at $50, and 33 percent at $100.
The review reaches the integrated structure and treats it as a benefit design fact, noting that Medicare Advantage enrollment typically includes medical and prescription coverage under the same plan. Risk adjustment, the CMS-HCC and RxHCC models, risk scores and plan liability appear nowhere in the paper.
That is a statement about scope rather than quality. It also marks where the unclaimed ground sits. The literature has mapped what the patient pays. What the plan earns for that same patient remains largely unexamined.
How does the RxHCC model differ from the CMS-HCC model?
CMS operates the CMS-HCC model for Part C and the RxHCC model for Part D. The CY2024 Rate Announcement puts the division plainly at page 129, stating that "the CMS-HCC risk adjustment model predicts the costs of Part A and Part B benefits, while the RxHCC model predicts plan liability for prescription drugs covered under the Part D program." The CY2026 Announcement is blunter still at page 13, noting that "None of the data presented here pertain to the Medicare Part D prescription drug benefit."
One clinical fact about one patient enters two regressions fitted against expenditure pools with no overlap.
| CMS-HCC (Part C) | RxHCC (Part D) | |
|---|---|---|
| Version in effect | 2024 model (V28), 100 percent for non-PACE plans | 2026 model, 2022/2023 calibration |
| Calibration data | 2018 diagnoses, 2019 expenditures | 2022 diagnoses, 2023 PDE |
| Dependent variable | Part A and Part B expenditures | Plan liability, defined standard benefit only |
| Annual denominator | $10,402.34 | $2,597.22, the published Part D denominator |
| Heart failure category | HCC 226, coefficient 0.360 | RxHCC 186, coefficient 0.135 |
| Coding pattern adjustment | 5.90 percent reduction, statutory floor | None. No Part D analogue exists |
| Normalization factor | 1.067 | 1.194 for MA-PD, 0.887 for PDP |
Exhibit 1. Source. CMS CY2026 Rate Announcement, Attachments VII and VIII, and CY2024 Rate Announcement, Table VIII-1. Part C coefficient reflects the community non-dual aged segment and Part D the community non-low-income aged 65 and over segment. Segment choice materially changes every figure.
The sixth row deserves attention. Part C risk scores are reduced 5.90 percent every year to correct for documentation behavior that differs from fee-for-service, a floor set by statute. Part D receives no equivalent correction. CMS explains the asymmetry in a footnote to the CY2026 Advance Notice, observing that section 1853(a)(1)(C)(ii)(I) requires MA risk adjustment to reflect fee-for-service coding trends while section 1860D-15(c)(1)(B) merely permits the Secretary to consider similar methodologies. Even the correction for how diagnoses get written down reaches one side of the divide.
How are risk scores converted to dollars?
Multiply the coefficient by the model denominator, after normalization and any coding pattern adjustment. The denominators are published. The Part D figure for 2026 is $2,597.22 of annual plan liability at a risk score of 1.0. The Part C side is harder, because CMS publishes benchmarks at county and regional level rather than a single national enrollment-weighted average. Using MedPAC's March 2026 figures for average plan bid and average rebate as a proxy puts a 1.0 risk score at roughly $1,354 per member per month.
Before running that arithmetic, one structural note. V28 splits heart failure into five categories, and the split matters less than the trade press suggested. HCC 224, HCC 225 and HCC 226 are coefficient-constrained, so acute, acute on chronic and chronic heart failure all carry 0.360. Reduced and preserved ejection fraction collapse into the same category. Only end-stage heart failure (I50.84, HCC 222, coefficient 2.505), assist device status, and transplant status move the risk score.
On the medical side, the only documented change in a heart failure patient's state that increases payment is deterioration toward end stage.
Exhibit 2. Source. Coefficients from CMS CY2026 Rate Announcement, Tables VIII-1 for both models. Part D denominator $2,597.22 as published. Part C base rate derived from MedPAC March 2026, Chapter 12, page 374, which projects plan bids at $1,132 per enrollee per month for 2026 after coding intensity and favorable selection, and reports rebates at $222. MedPAC does not sum the two. Treat the Part C dollar figure as approximate. The marginal row reflects the RxHCC hierarchy, under which RxHCC 186 supersedes RxHCC 187 Hypertension at 0.046.
A plan's incentive to identify, document and code heart failure sits almost entirely on the medical side of the house, which is also where risk adjustment tooling has overwhelmingly been built. Heart failure is the worked example here rather than the boundary of the problem. The same structure appears wherever a condition is managed principally with drugs.
That concentration has a documented cost. Oliver Wyman's analysis of the Part D model found that 23 of the 84 RxHCC categories "consist of nearly all non-payment ICD-10s on Part C or have significant overlap, but with some of the most prevalent codes not contributing to Part C payments," and concluded that "a risk adjustment strategy focused purely on Part C risk scores will almost certainly result in blind spots for Part D risk revenue optimization." Their explanation for why those diagnoses go uncoded describes the substitution directly.
"It is often the case that the conditions that risk adjust on Part D, but not on Part C, can be managed through prescription drugs alone and are not necessarily accompanied with regular doctor visits. This increases the likelihood that these conditions will not be coded every year and will fail to be reflected in the risk score." Oliver Wyman, February 2024.
Note the attribution carefully. This is Oliver Wyman's characterization, published in 2024, and it is not CMS language. Search tools frequently return this sentence without attribution in a way that implies CMS wrote it, and it appears in none of the CY2025, CY2026 or CY2027 Advance Notices or Rate Announcements. The observation is useful and the sourcing should be stated plainly.
What CMS does say, in the CY2027 Advance Notice at page 84, is that RxHCC diagnoses come from encounter data and fee-for-service claims. The drug model is fed exclusively by medical diagnoses and never by pharmacy data. A condition managed successfully with medication, generating fills but few encounters, is therefore harder to see in the model built to predict the cost of those very medications.
The diagnosis is permanent, the payment is annual
There is a sharper version of that problem, and it sits between the clinical definition and the payment rule.
The 2026 Second Universal Definition of Heart Failure states that once symptomatic heart failure is established, "individuals with HF are generally considered to have the diagnosis permanently, even if the clinical condition improves with treatment." The same document recognizes heart failure with improved ejection fraction as its own category, noting these individuals remain at risk for heart failure events.
Both Medicare risk models are prospective and require the diagnosis to be re-documented in each calendar year. A condition the clinical community regards as permanent disappears from the payment system unless a qualifying encounter re-asserts it every twelve months.
Follow that through for the patient the guidelines describe as a success. Four drug classes, stable, ejection fraction recovered, few visits. Clinically this person still has heart failure. If the year passes without an encounter documenting it, the plan loses roughly $5,160 on the medical side and $294 on the drug side, and the risk score reports a healthier member than the one it is covering.
The documentation standard compounds it. Supporting an HCC requires evidence that the condition was monitored, evaluated, assessed or treated. In heart failure the treatment is medication, which generates pharmacy claims the medical model never reads and the drug model is not permitted to read either.
Can Part D savings be used to lower a Medicare Advantage bid?
No, and this is the mechanism that holds the divide in place. The usual explanation points to separate teams, separate systems and separate scorecards. In Medicare the binding constraint is narrower and far more durable.
The CY2024 Medicare Advantage Bid Pricing Tool instructions state, at page 8, that "the revenue requirement in the MA BPT must reflect the costs for providing MA services; it must not include the cost for non-MA services (such as Part D)." Organizations submit separate bids for Part C and Part D, with separate cost lines, proportional allocation of shared administrative expense, and a rule that the two margins must sit within 1.5 percent of each other without being combined.
The financial channel between them runs one way. Under 42 CFR 422.266(b), Part C rebates earned from Part A and Part B savings may be applied to three uses, two of which reach the drug benefit, buying down the Part D premium and funding supplemental drug coverage. KFF reported in June 2026 that MA-PD sponsors allocated more than $600 per enrollee per year through that channel, roughly $13 billion. Part D savings do not enter the rebate calculation at all, because rebates are computed solely from the benchmark comparison on the medical side, and no line in the MA bid could receive a drug-side saving. When a rebate does flow to Part D, the Part D bid books it as revenue rather than as a reduction in cost.
The practical effect is that savings generated on the medical side can be recycled into the drug benefit, while a saving generated inside the pharmacy program has no channel back to the enterprise that funded it.
One caveat belongs in print, because it is the kind of thing that gets overstated. CMS never writes the converse prohibition. No instruction reads that the Part D bid must exclude medical savings. The constraint is enforced through the structure of the cost lines rather than through a quotable sentence, and anyone citing this should say so.
Where the standard account needs correcting
Two things a confident version of this argument would get wrong.
The medical loss ratio is combined, not separated. Under 42 CFR 422.2420(a)(2)(ii), an MA contract that includes MA-PD plans "must also reflect costs and revenues for benefits described at section 423.104(d) through (f)." One ratio per contract, Part C and Part D pooled, against the same 85 percent floor. At the compliance layer that actually constrains plan profit, CMS already treats the two benefits as a single pool. Any version of this argument resting on regulatory accounting fails here, which is why it should rest on the bid.
Integrated plans do partially internalize the offset. Starc and Town found that plans carrying medical risk offer more generous drug coverage than drug-only plans, with the effect "driven by drugs that reduce medical expenditure and treat chronic conditions." Their estimates put MA-PD enrollees at roughly 11 percent lower out-of-pocket cost for an identical drug bundle in the coverage gap, a dollar of additional drug spending reducing non-drug spending by about 27 cents, and standalone drug plans imposing an externality of roughly $378 million a year on traditional Medicare.
Three considerations keep that from overturning the thesis. The generosity appears to be rebate-financed, and MedPAC's own estimates show MA-PD and standalone premiums would be roughly on par without the buydowns. MedPAC lists medical offsets as one of three candidate explanations for the MA-PD cost advantage and has never quantified it. The one deliberate policy experiment also failed to produce the offset, since the Value-Based Insurance Design evaluation published in March 2026 found 92.6 percent of participating plans chose Part D cost-sharing reductions and delivered a 1.1 percentage point adherence gain, while inpatient stays rose 15.5 percent in 2020 and 8.1 percent in 2021 with no significant association in 2022. The model was subsequently discontinued.
The defensible position is that integration narrows the divide through rebate arbitrage without closing it through total-cost optimization. For a beneficiary in a standalone drug plan alongside fee-for-service Medicare, the argument has no purchase at all, because avoided hospitalizations accrue to the Trust Fund and the plan that funded the therapy receives nothing.
The calibration moat
The concept is worth naming, because it describes a class of problem rather than a single instance.
A calibration moat exists wherever two payment models are fitted against disjoint cost pools for the same population. Both models can be individually well specified and accurate within their own pool, and CMS publishes predictive ratios showing that they are. The limitation appears only in the space between them, where a substitution from one pool to the other remains invisible in both dependent variables. Data integration does not resolve this, because the barrier sits in the regression specification rather than in the data supply.
That reframes the closing argument of the paradox piece. Connective infrastructure, data crossing the medical-pharmacy boundary, and formulary governance measured on total cost of care all remain necessary. None of it touches a payment system that prices heart failure at 0.360 on one side and 0.135 on the other.
The same problem, by seat
| Role | The question worth answering now |
|---|---|
| Medicare Advantage plan | Does your Part D actuary receive any credit for avoided Part A and Part B utilization, and if not, which governance forum holds the combined number? |
| Standalone drug plan | You carry most of a heart failure regimen against a risk weight a fraction the size of the medical one. What is your actual per-member economics on guideline therapy? |
| Health system in risk | Your risk adjustment program is built around the medical model, where heart failure pays roughly 17 times what it pays on the drug side. Who owns drug-side coding accuracy? |
| Manufacturer, cardiorenal | Your dossier quantifies avoided hospitalization. The budget holder cannot book that saving in the bid that pays for your product. Does your model address the payer's actual ledger? |
| Risk adjustment vendors | Your models are fitted to the medical side, because that is where the coefficient value sits. What would a combined Part C and Part D opportunity model change about client priorities? |
| CMS and policymakers | Both models are individually well calibrated and jointly unable to price a substitution between benefits. Is that an acceptable steady state for chronic conditions where drug therapy substitutes for hospitalization? |
Erik's Hot Take
Return to where this started. The medical model pays for a heart failure diagnosis, and the documentation standard that justifies the payment asks the plan to show it is treating the condition. The treatment is four drug classes bought on the other side of the house, against a risk weight a fraction the size, in a filing that cannot reference the payment it supports.
Heart failure is the cleanest case because the clinical evidence is settled, the therapy is expensive, and the offset is large and measured. The gray space is that both risk models are doing exactly what they were designed to do, and the combined result still points away from a serious medication management program.
The white space sits with whoever builds the combined view first. A model that scores a member across both benefits, prices the offset explicitly, and tells a plan what guideline therapy is worth to the enterprise rather than to the pharmacy budget does not exist in any commercially available form. The data already flows to both models. What is missing is the willingness to compute a number that no bid will accept.
Two companion pieces take this further. Why the RxHCC heart failure coefficient fell in 2026 examines what happened when negotiated prices and the benefit redesign moved in the same year. Whether Stage B heart failure risk adjusts follows the problem upstream, to the point where neither model can represent the patient.
Frequently asked questions
How does the RxHCC model differ from the Part C CMS-HCC model?
The CMS-HCC model predicts Part A and Part B expenditures and drives Medicare Advantage payment. The RxHCC model predicts Part D plan liability for prescription drugs. Both draw diagnoses from the same claims and encounter records, and each is calibrated against its own expenditure pool with no overlap. They use different categories, different denominators and different normalization factors.
What is a heart failure diagnosis worth in Medicare risk adjustment?
In payment year 2026, chronic heart failure carries a coefficient of 0.360 in the CMS-HCC model and 0.135 in the RxHCC model, in the community non-dual aged and community non-low-income aged segments. Dollarized, that is roughly $5,160 a year on the medical side against roughly $294 on the drug side.
How are risk scores converted to dollars?
Multiply the condition coefficient by the model denominator, after dividing by the normalization factor and applying any coding pattern adjustment. CMS publishes the Part D denominator at $2,597.22 for 2026. On the Part C side CMS publishes benchmarks at county and regional level rather than a single national enrollment-weighted average, so that side requires a proxy drawn from MedPAC bid and rebate figures.
Can Part D savings be used to lower a Medicare Advantage bid?
No. Medicare Advantage organizations submit separate Part C and Part D bids, and the bid instructions state the MA bid must not include the cost of non-MA services such as Part D. Part C rebates earned from medical savings may buy down the Part D premium, and no channel runs in the other direction.
If heart failure is a permanent diagnosis, why does the risk score reset every year?
Because the clinical definition and the payment rule answer different questions. The 2026 Second Universal Definition treats heart failure as permanent once established, even when the condition improves with treatment. Both Medicare risk models are prospective and require a qualifying encounter to re-document the diagnosis in each calendar year. A well-managed patient with few encounters can therefore lose the risk weight while still having the disease.
What is a calibration moat?
A calibration moat exists wherever two payment models are fitted against disjoint cost pools for the same population. Each model predicts its own pool well. Neither can price a substitution between them, because the substitution does not appear in either dependent variable. Better data integration does not resolve it, because the constraint is the model specification.
Method and sources
Coefficients, normalization factors, coding pattern adjustments and model denominators come from the CMS CY2026 Rate Announcement and CY2026 Advance Notice, with prior-year comparisons from the CY2025 and CY2024 Rate Announcements. Part C coefficients reflect the community non-dual aged segment and Part D the community non-low-income aged 65 and over segment. Segment selection materially changes every figure shown, and institutional and dual-eligible segments differ substantially.
The Part C dollar translation is derived rather than published. CMS publishes county and regional benchmarks, and a national per-capita cost figure, rather than a single national enrollment-weighted average base rate per member per month. The figure used here combines MedPAC's March 2026 projected plan bid of $1,132 per enrollee per month with its reported rebate figure of $222, two figures MedPAC presents separately with slightly different denominators and does not itself sum. The bid figure is a projection conditioned on coding intensity and favorable selection adjustments. Treat all Part C dollar figures as approximate and directional.
Coverage, tiering, cost-sharing and willingness-to-take figures come from Lowe et al., a JACC state-of-the-art review published in 2025 reflecting a 2023 all-plan formulary analysis. Clinical staging and the permanence of the heart failure diagnosis reflect the 2026 AHA, ACC, ESC and WHF Expert Consensus Document, Second Universal Definition of Heart Failure, published in Circulation in August 2026. Plan behavior evidence comes from Starc and Town in the Review of Economic Studies (2020), KFF analysis published June 2026, MedPAC reports from June 2025 and March 2026, and the RAND evaluation of the Value-Based Insurance Design model published March 2026.
The observation that conditions risk adjusting on Part D but not Part C may be managed with drugs alone without regular encounters is Oliver Wyman's, published February 2024, and is quoted here with that attribution. It was checked against the CY2025, CY2026 and CY2027 Advance Notices and Rate Announcements and appears in none of them. Bid and actuarial language is quoted from the CY2024 Medicare Advantage Bid Pricing Tool instructions at page 8 and the CY2025 Part D instructions, together with 42 CFR 422.266, 422.2420, 423.265 and 423.272. CMS publishes no sentence prohibiting medical savings from appearing in a Part D bid, and no such prohibition should be attributed to the agency.
This piece is analysis and commentary based on public sources and professional experience as of the date noted, and nothing in it constitutes legal, clinical, or financial advice. Descriptions of risk adjustment, bid, and formulary practices are general characterizations of common industry structures and are not directed at any specific company or plan. Interpretive conclusions are the author's opinion, offered for analytical discussion. All views reflect independent professional judgment and do not represent the views or positions of any current or former employer or affiliated organization.